
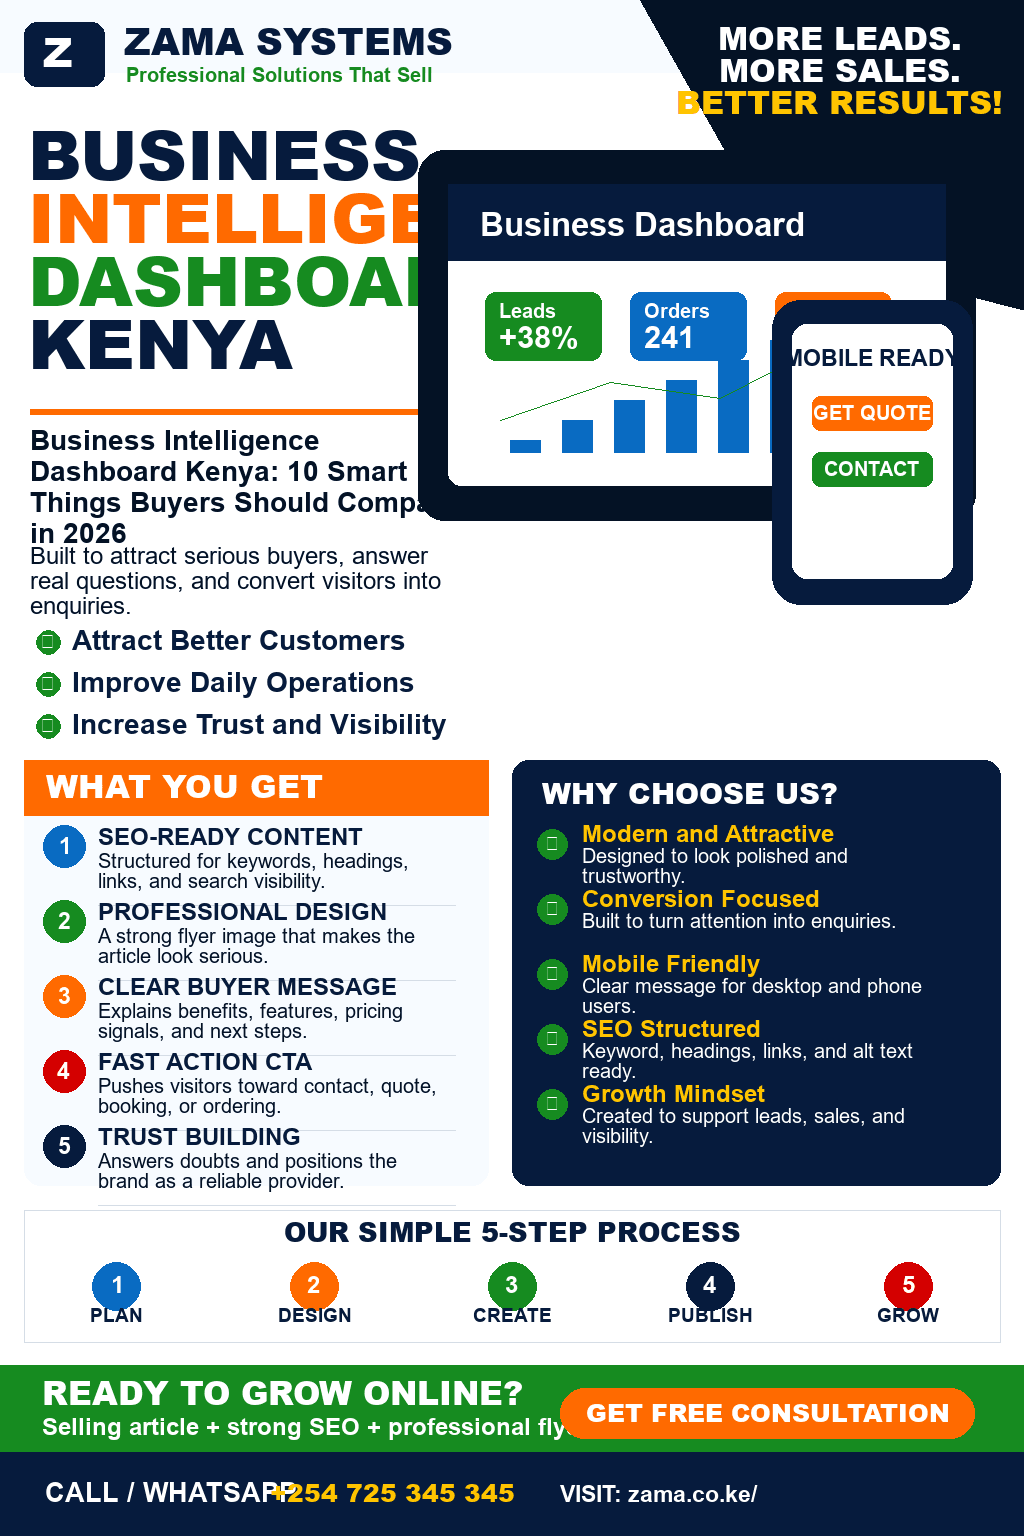
, we design custom Business Intelligence dashboards that help businesses in Kenya monitor performance, identify trends, and make data-driven decisions.
📞 Call us today: +254725345345
What Is a Business Intelligence Dashboard?
A Business Intelligence Dashboard is a web-based reporting platform that collects data from different business systems and presents it through visual charts, graphs, tables, and key performance indicators (KPIs).
Instead of reviewing multiple reports from different departments, managers can view everything from one dashboard.
Business Intelligence dashboards provide instant visibility into business operations, helping organizations react quickly to changing conditions.
Why Businesses in Kenya Need Business Intelligence
Modern businesses generate large volumes of information.
Without proper reporting systems, organizations often experience:
- Slow decision-making
- Inaccurate reports
- Duplicate data
- Limited business visibility
- Poor forecasting
- Missed business opportunities
Business Intelligence software transforms this information into valuable insights.
Benefits of Business Intelligence Dashboards
Real-Time Business Monitoring
Business owners can monitor operations as they happen.
There is no need to wait for weekly or monthly reports.
Better Decision Making
Managers make informed decisions using accurate, up-to-date business data.
Improved Productivity
Employees spend less time preparing reports manually.
Automation saves valuable working hours.
Increased Profitability
Identifying profitable products, services, and customers helps businesses maximize revenue.
Better Financial Management
Monitor:
- Revenue
- Expenses
- Cash flow
- Profit margins
- Outstanding invoices
from one dashboard.
Enhanced Customer Insights
Understand customer behavior by tracking:
- Sales trends
- Buying patterns
- Customer retention
- Service performance
Key Features of a Business Intelligence Dashboard
Interactive Charts
Visualize business data using:
- Line charts
- Pie charts
- Bar graphs
- Heat maps
- Trend graphs
Interactive visuals simplify complex information.
KPI Monitoring
Track important Key Performance Indicators such as:
- Revenue growth
- Sales targets
- Customer acquisition
- Employee productivity
- Inventory turnover
- Profitability
Custom Reports
Generate reports tailored to your organization.
Examples include:
- Daily sales
- Monthly revenue
- Inventory movement
- Customer activity
- Financial summaries
Multi-Department Reporting
Combine information from:
- Finance
- HR
- Inventory
- Sales
- Procurement
- Customer Service
into one platform.
Data Filtering
Users can filter reports by:
- Date
- Branch
- Department
- Employee
- Product
- Customer
This improves analysis and reporting flexibility.
Mobile Access
Managers can access dashboards securely from smartphones, tablets, or laptops.
Industries That Benefit from Business Intelligence
Retail
Analyze:
- Sales performance
- Inventory turnover
- Customer purchasing trends
- Supplier performance
Healthcare
Monitor:
- Patient visits
- Revenue
- Medical inventory
- Staff performance
Real Estate
Track:
- Rental income
- Property occupancy
- Maintenance costs
- Agent performance
Manufacturing
Analyze:
- Production efficiency
- Machine utilization
- Inventory
- Quality control
Schools
Monitor:
- Student enrollment
- Fee collection
- Academic performance
- Staff productivity
Logistics
Track:
- Delivery performance
- Fleet utilization
- Fuel consumption
- Customer orders
Business Intelligence and Artificial Intelligence
Modern BI systems integrate Artificial Intelligence to provide deeper insights.
AI can:
- Predict future sales
- Detect unusual business activity
- Identify customer trends
- Forecast inventory demand
- Recommend operational improvements
These capabilities help organizations make proactive decisions.
M-Pesa Integration
Business Intelligence dashboards can integrate with M-Pesa to provide real-time financial reporting.
Businesses can monitor:
- Daily collections
- Payment trends
- Revenue by branch
- Outstanding balances
- Transaction history
This creates a complete financial overview.
Cloud-Based Business Intelligence
Cloud technology enables businesses to access reports from anywhere.
Benefits include:
- Secure access
- Automatic backups
- Multi-user support
- Real-time synchronization
- Easy scalability
Cloud dashboards are ideal for businesses with multiple branches.
Technologies Used by Zama Web Experts
Our Business Intelligence solutions are built using modern technologies such as:
- Laravel
- React
- Vue.js
- Python
- Node.js
- PostgreSQL
- MySQL
- Power BI Integration
- REST APIs
- Cloud Infrastructure
These technologies ensure reliable performance, high security, and scalability.
Why Choose Zama Web Experts?
, we build Business Intelligence solutions that transform business data into actionable insights.
Our services include:
- Business Intelligence Dashboards
- Custom Reporting Systems
- ERP Development
- CRM Development
- AI Business Solutions
- SaaS Development
- Data Visualization
- Workflow Automation
- M-Pesa Integration
- API Development
- Software Maintenance & Support
We work closely with businesses to create dashboards that provide meaningful information and support strategic growth.
Frequently Asked Questions
What is Business Intelligence?
Business Intelligence is the process of collecting, analyzing, and presenting business data to support informed decision-making.
Can Business Intelligence integrate with my ERP or CRM?
Yes. We can integrate BI dashboards with ERP systems, CRM software, accounting platforms, inventory systems, HR software, and many other business applications.
Is Business Intelligence suitable for small businesses?
Absolutely. Small businesses benefit from real-time reporting, improved efficiency, and better financial visibility.
Can I access my dashboard remotely?
Yes. Our cloud-based dashboards allow secure access from any location using a computer, tablet, or smartphone.
Conclusion
Data is one of the most valuable assets any business possesses. However, data only becomes valuable when it is transformed into meaningful insights that guide better decisions.
A Business Intelligence Dashboard helps businesses monitor performance, improve productivity, identify opportunities, and achieve sustainable growth.
If you’re looking for professional Business Intelligence Dashboard Development in Kenya, partner with Zama Web Experts
.
Contact Zama Web Experts
📞 Phone: +254725345345
🌐 Website: Zama Web Experts
📍 Location: Ruiru, Kenya